3 min read
DataTour 2026: why calibrating my model cost me points
In June 2026, my team Winner299 and I took part in the national phase of DataTour, the Africa Cup of Nations in Data Science (CANSD), run by Data Afrique Hub from 13 June to 4 July. The task: estimate, for each mobile money transaction, the probability that it is fraudulent. The metric: Average Precision, the area under the precision-recall curve (PR-AUC).
Look at the data before choosing a model
The training set holds about 1.29 million transactions, the test set about 430,000. Two observations changed everything before I trained a single model.
- All the fraud sits in a single operation type. The other four types contain none. So I only modelled that operation type and gave everything else a probability of zero.
- The split is temporal. Training covers periods 0 to 105, test covers periods 106 to 143. The test set is the future.
Time is a trap
Within that operation type, the fraud rate drifts: around 49% at the start, around 30% at the end. Feeding the period number to the model would have taught it a trend that does not necessarily continue into the test. So I dropped the raw period from the features and validated on periods 90 to 105, as a dress rehearsal for the real test.
Describe behaviour, without leakage
99% of the accounts in the test set already appear in training. Each account's history is therefore valuable, as long as the model never sees the future. I built:
- a cumulative fraud rate per account, computed only on past transactions;
- a per-account target encoding, computed with cross-validation to avoid leakage;
- network features, such as the number of distinct senders sending to the same recipient.
The final model is an ensemble of LightGBM models trained with several seeds, whose ranks I average.
The mistake that cost me a hundredth
By the end, the leaderboard was extremely tight: the top nine teams sat between 0.3560 and 0.3577. My platform score was stuck at 0.3531, while my validation promised more. Looking for the gap, I found the culprit: an isotonic calibration step at the end of the pipeline.
Average Precision only depends on the order of the predictions:
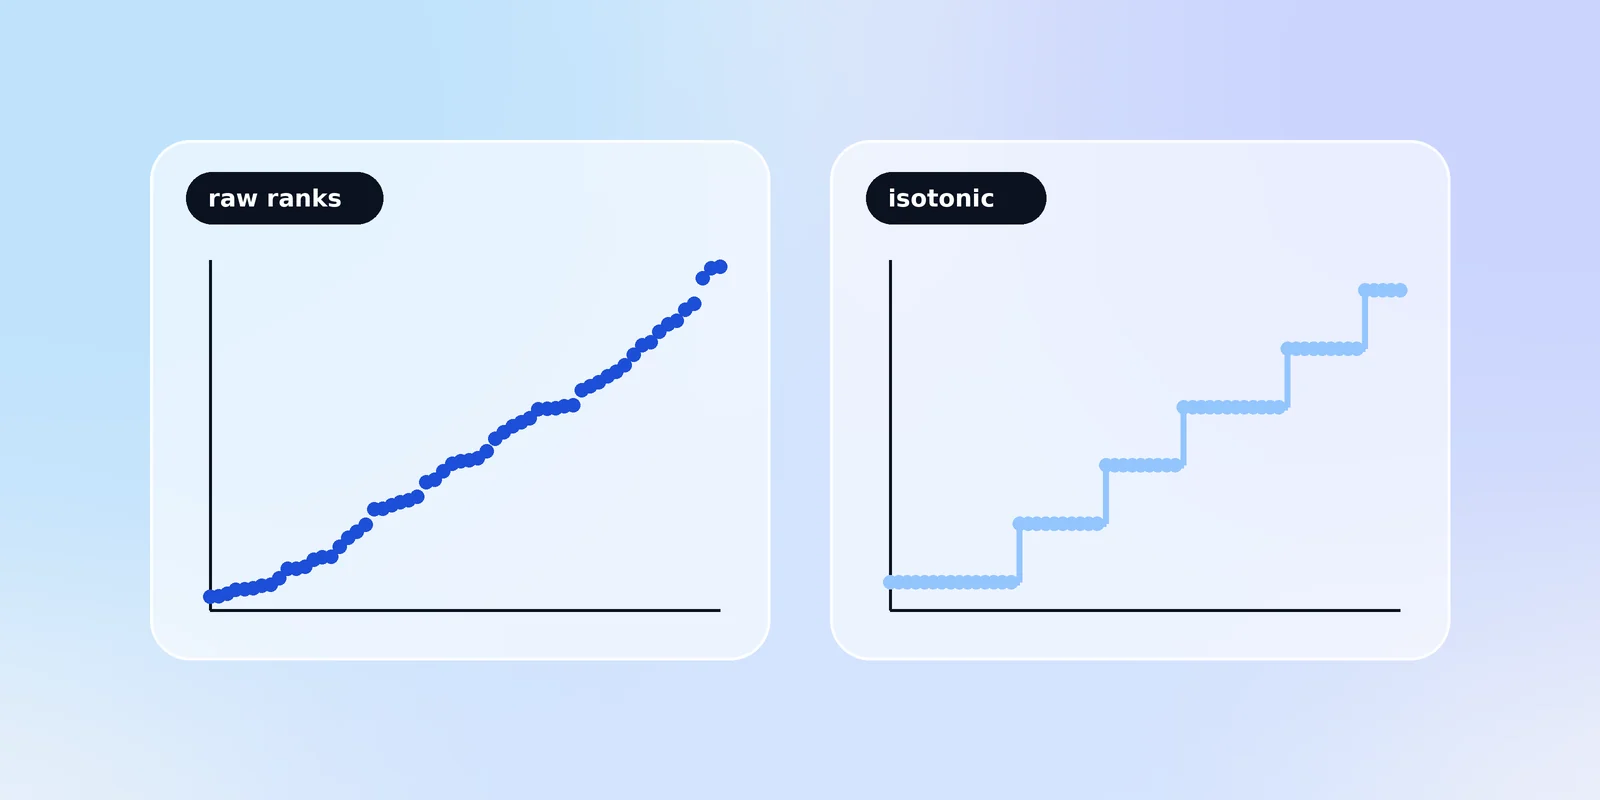
where and are precision and recall at the -th threshold. Doubling every probability changes nothing: only who ranks above whom matters. But isotonic regression produces a step function. On my validation set it squashed about 21,000 distinct scores into just 16 values. Thousands of transactions end up tied, and the model loses its ability to separate them.
Measured on the same validation set: 0.3609 before calibration, 0.3509 after. A hundredth lost, which explained most of the gap with my submission. The fix is two lines: output the raw ranking, with no calibration at all.
from scipy.stats import rankdata

# Final output: the raw ranking, normalised to [0, 1].
scores = rankdata(raw_scores) / len(raw_scores)
A weak signal, a noisy validation
One last lesson: the signal was weak by nature, with correlations of at most 0.12 between features and target. Under those conditions, validation itself becomes noisy. Depending on the window, the same model scored 0.366, 0.347 or 0.361. So I pooled the whole 90 to 105 window and averaged ten seeds before comparing two ideas. Without that, I would have mistaken noise for progress.
What I take away
- Check that every step respects the metric. Calibration improves probabilities, not rankings.
- Understanding the structure of the data (where the fraud is, how time is split) pays off more than any hyperparameter tuning.
- Measure the noise of your own validation before celebrating an improvement, especially when everything is decided by thousandths.